To design a user-centric analytics dashboard that provides an intuitive overview of form submissions. The goal was to enable users to monitor, analyze, and gain actionable insights into their form data with ease, leveraging graphical UI components for a visually engaging experience.
Challenge: Balancing detailed data visualization with a clutter-free interface. Solution: Implemented collapsible sections and user-customizable widgets. Challenge: Ensuring scalability for large datasets. Solution: Designed with scalable UI components and efficient data handling techniques.
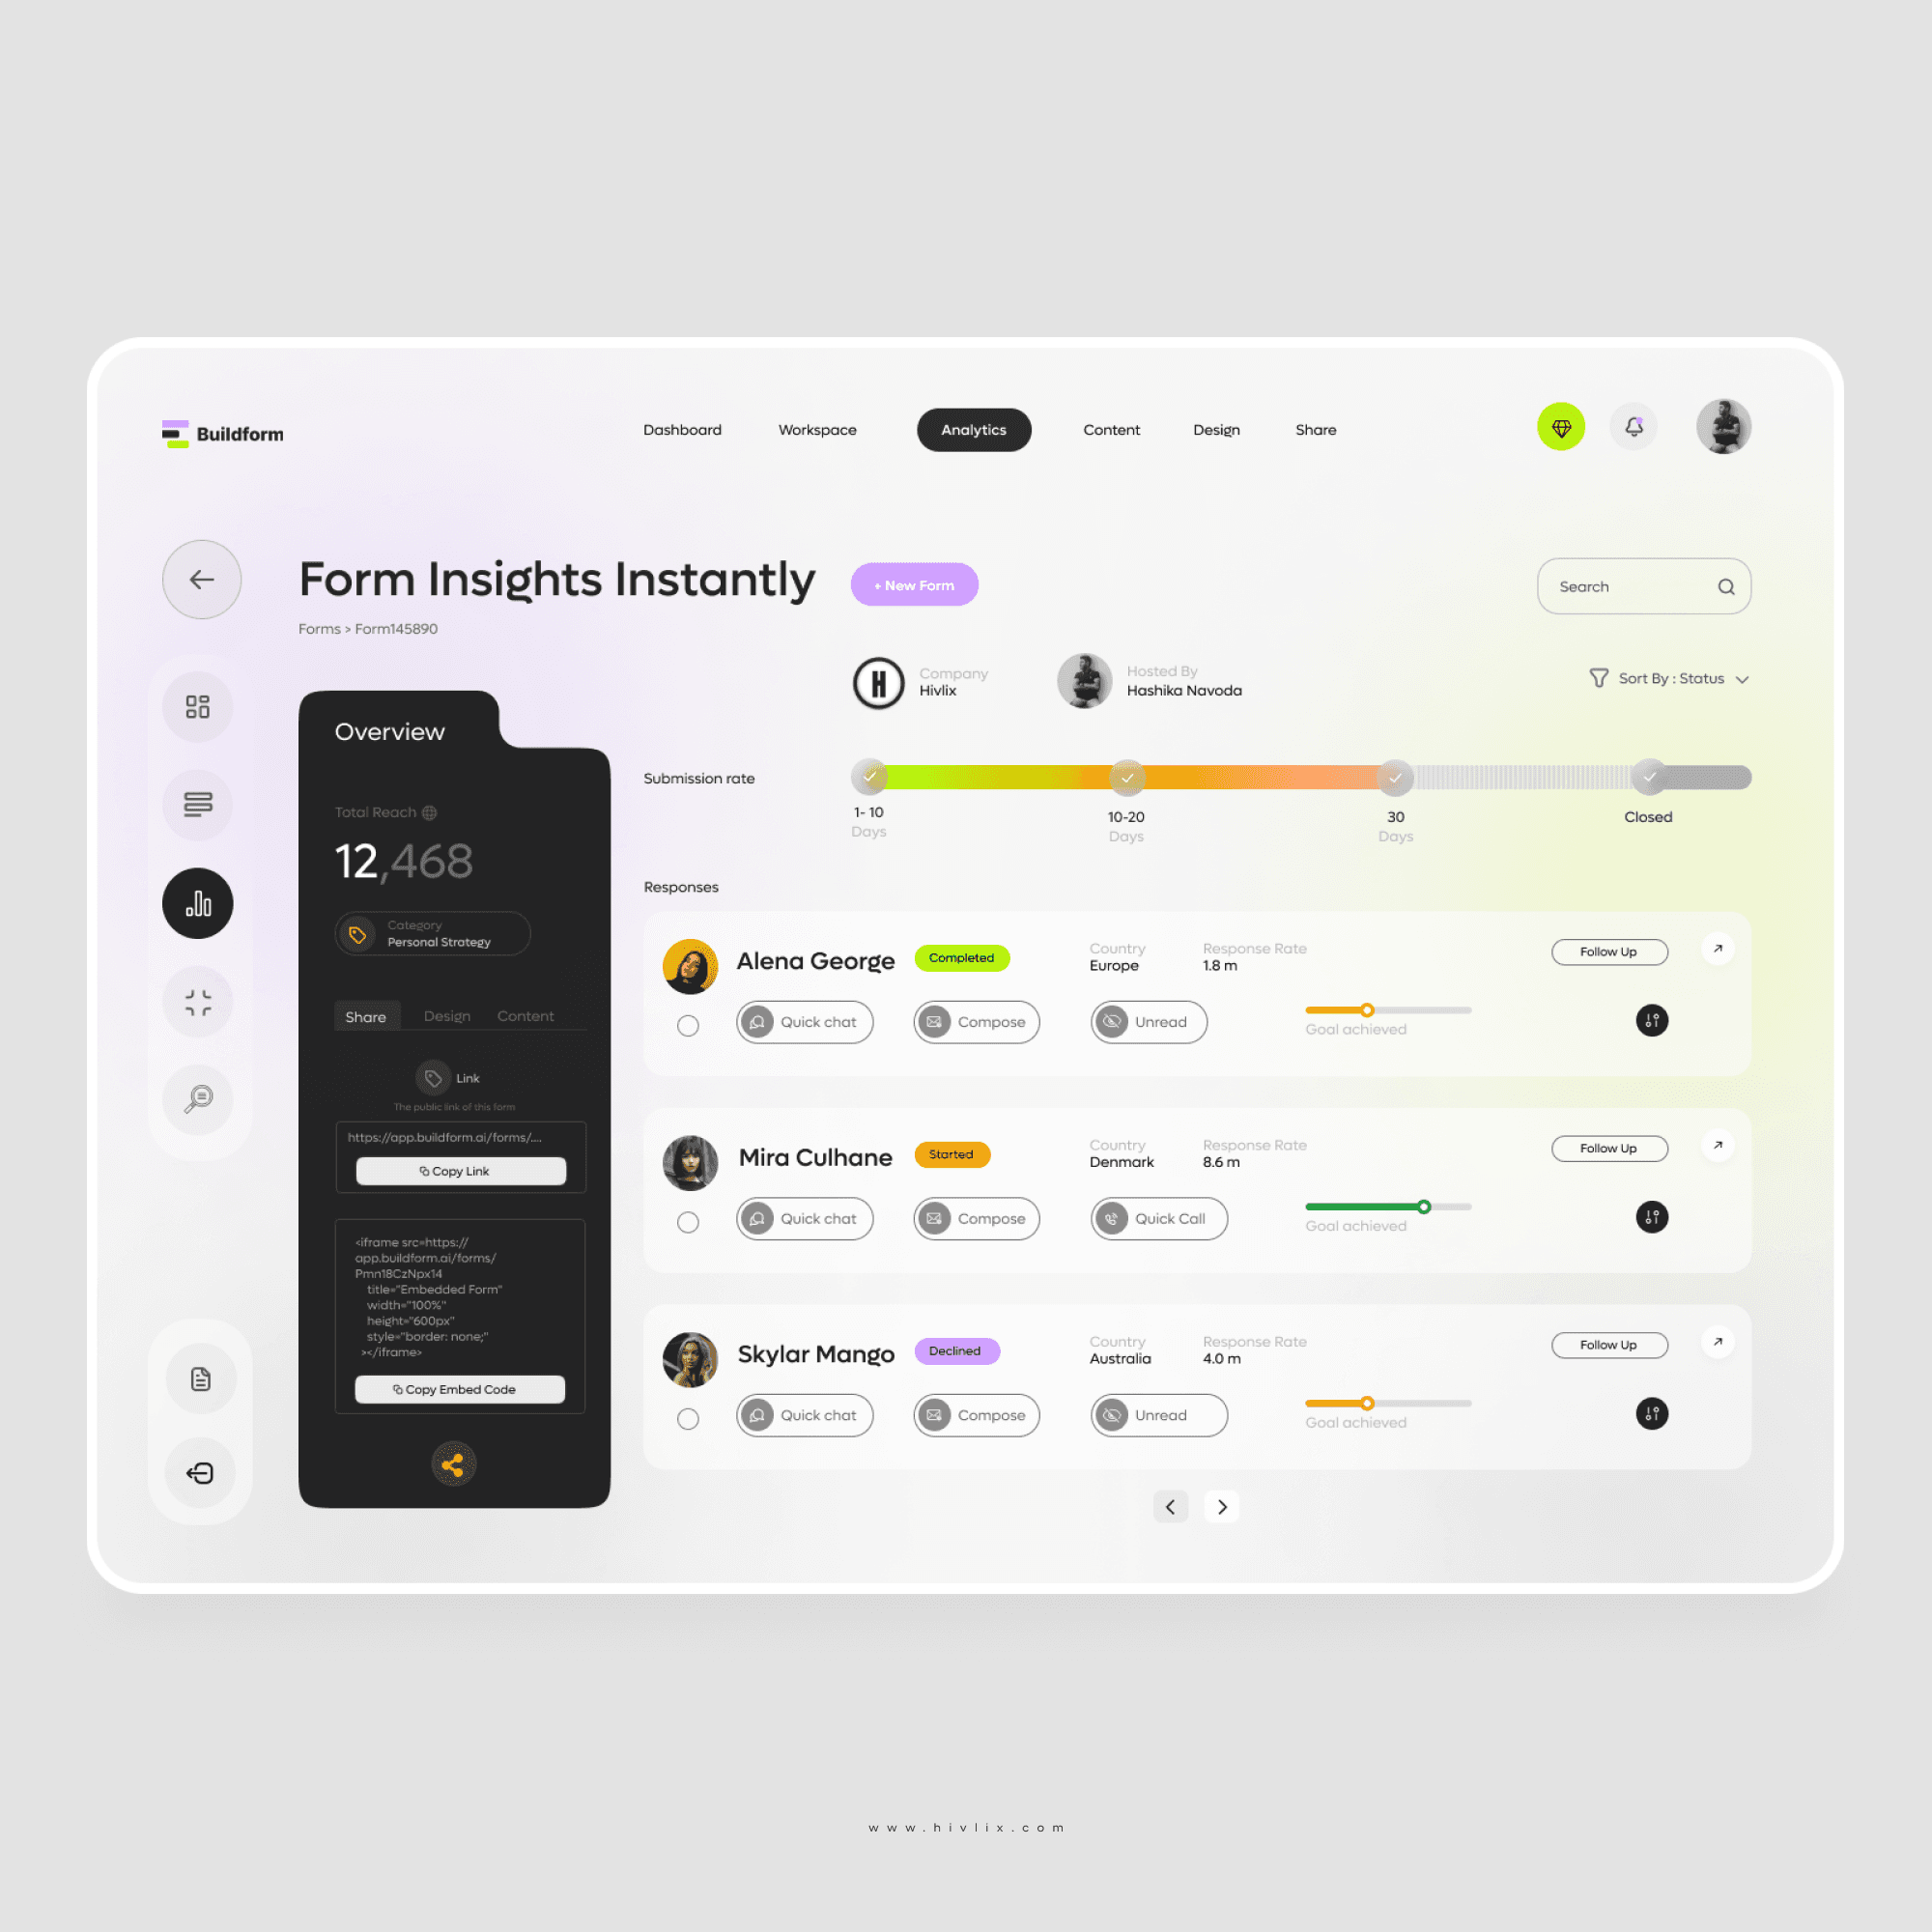
The Form Analytics Web App is designed to streamline the analysis of form submissions. It consolidates key metrics and visualizations into a centralized dashboard, empowering users to make data-driven decisions. The concept centers on simplicity, usability, and clarity, ensuring that even non-technical users can understand and act on the insights provided.
Key Features
Submissions Overview
Total submissions displayed with real-time updates.
Categorization of submissions by type, frequency, and geographic location.
Easy access to historical data for trend analysis.
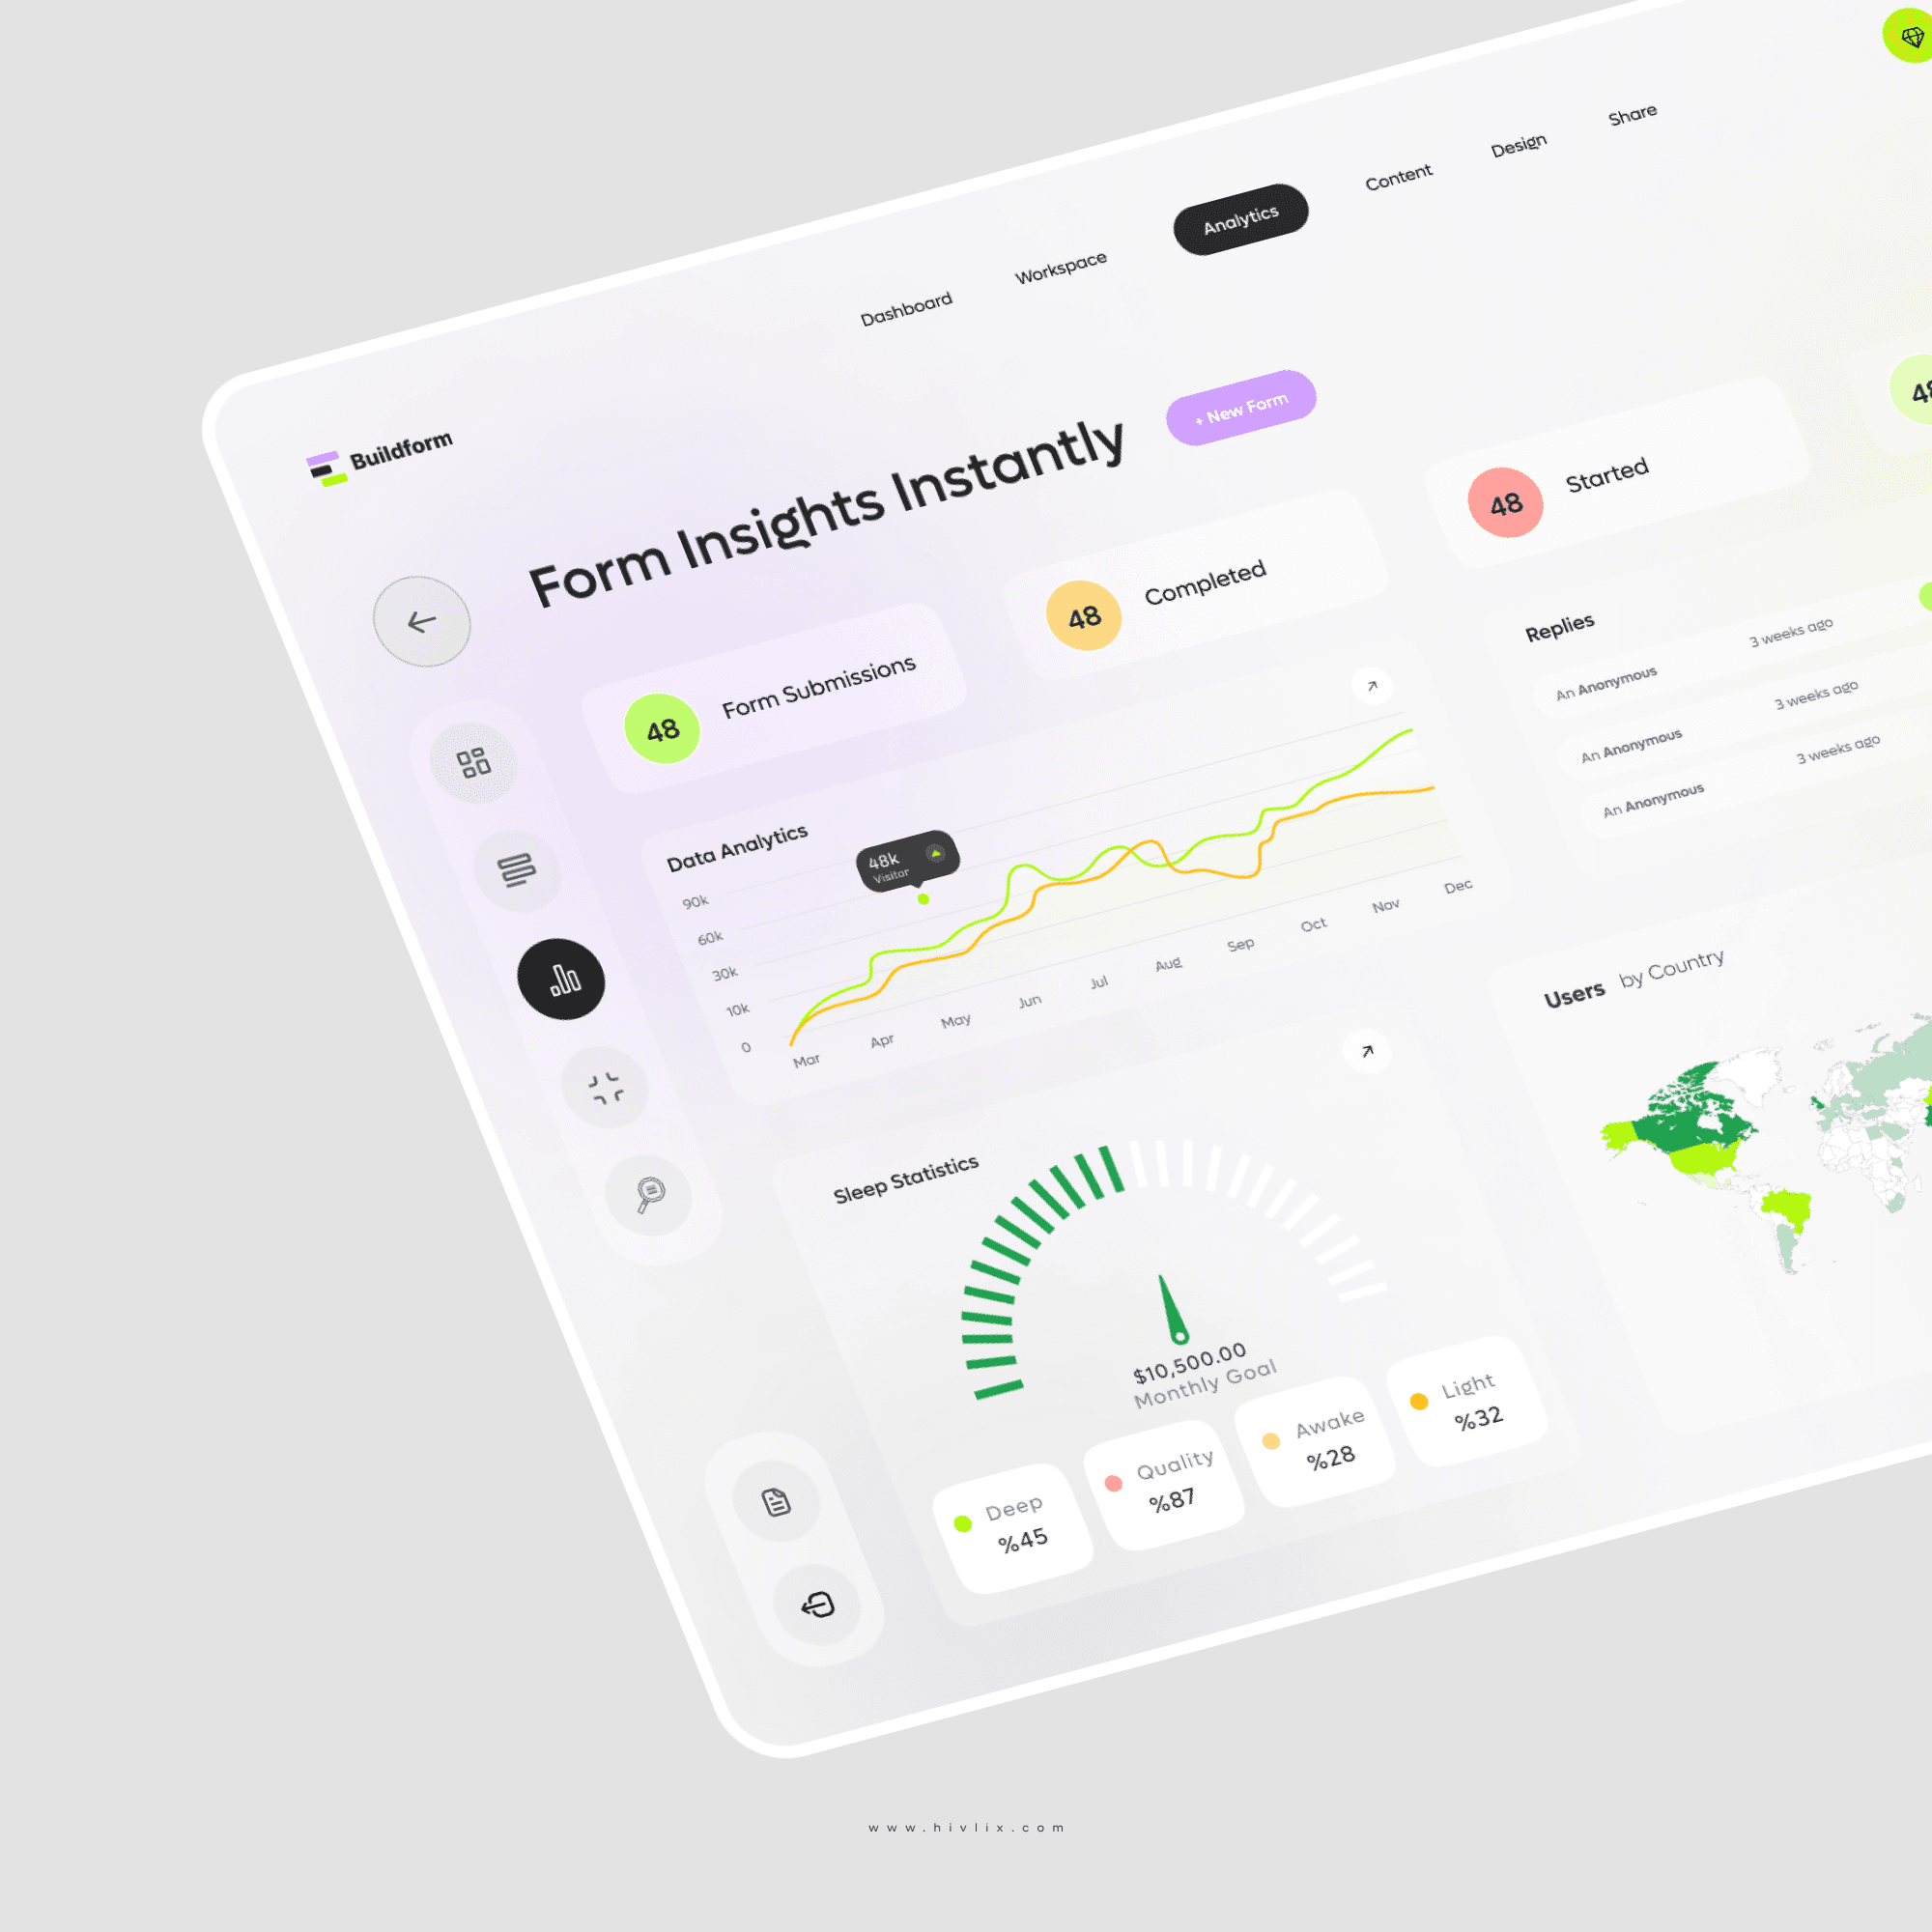
User Demographics and Behavior
Visualization of user types (e.g., new vs. returning users).
Insights into submission frequency patterns (daily, weekly, monthly).
Identification of peak submission times for better planning.
Geographic Insights
Interactive maps showing submission hotspots by location.
Drill-down capability for granular location-based data.
Regional comparisons to identify trends and opportunities.
Graphical Visualization
Line charts for submission trends over time.
Pie charts for distribution of submission types.
Heatmaps for geographic and temporal insights.
Bar graphs for frequency and user segmentation analysis.
Filters and Customization
Advanced filtering options (date range, user type, location).
Customizable dashboard to focus on preferred metrics.
Downloadable reports in various formats (PDF, CSV).
Real-Time Monitoring
Live submission tracking with instant updates.
Alerts for unusual activity or spikes in submissions.
Accessible and Responsive Design
Designed to be fully responsive for mobile, tablet, and desktop.
Accessibility considerations for diverse user needs.